
Best time to trade forex: find your own hours from your MT5 trades
Generic guides tell you when the market is busy. Your own trades tell you when you trade well. A step-by-step way to group your results by hour without fooling yourself.
The best time to trade is the best time for you
Search for the best time to trade forex and almost every result tells you the same thing: the London and New York overlap is the busiest window, because two big financial centres are open at once. That is useful for knowing when the market is liquid. It does not tell you when you trade well. Your results depend on your strategy, your instruments, your attention and your life, and the only way to find your own best hours is to look at your own trades.
This guide shows how to do that with the data you already have in MetaTrader 5, step by step, with a spreadsheet or with the Excel report from AI Trading Journal, and how to avoid the main traps: broker time, small samples and acting on a pattern that is only noise.
Step 1: get every trade with a time
You need one row per closed trade with a time and a net result. MetaTrader 5 gives you both in the History tab: choose the period, save a report and open it in a spreadsheet. The MT5 history export guide shows how.
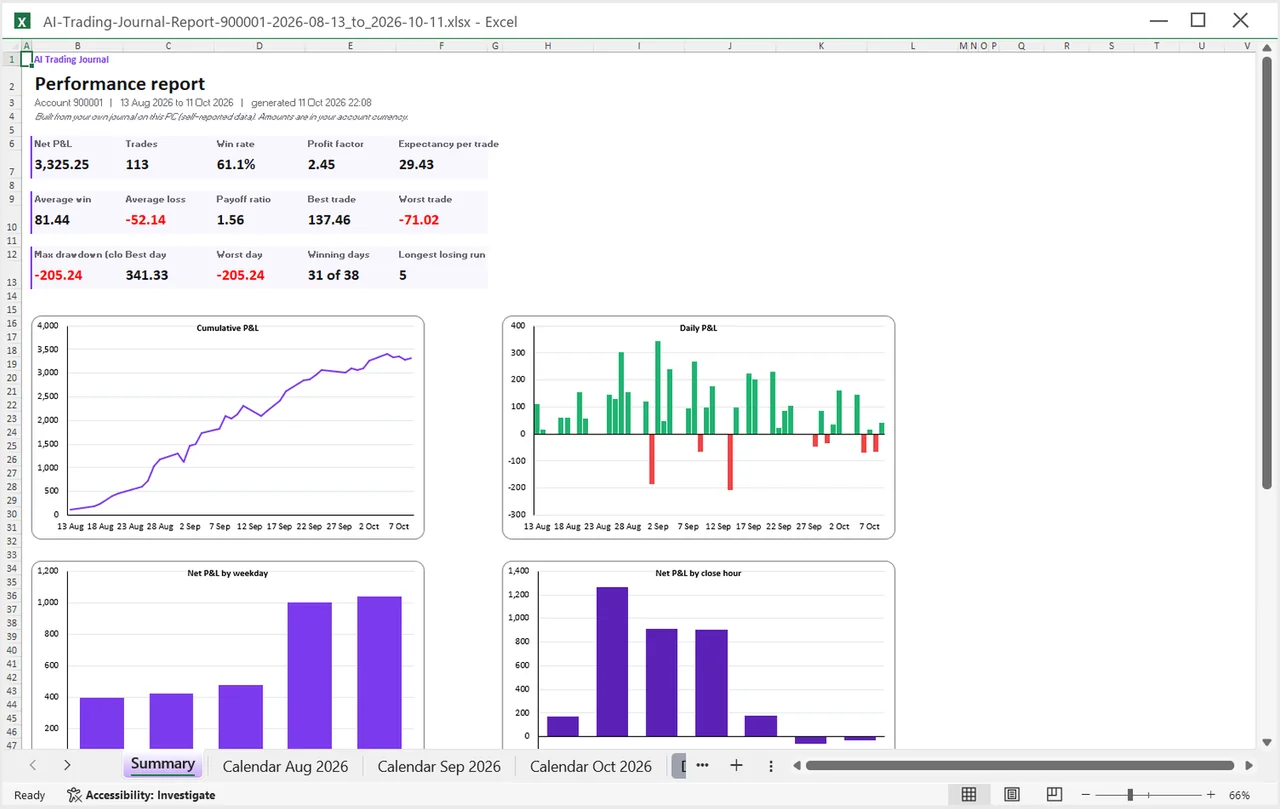
If you use AI Trading Journal, Export Report builds the workbook for you. Its Trades sheet has one row per closed position with the open time, the close time and the net result, and its Summary sheet already includes charts of net P&L by close hour and net P&L by weekday built from live formulas. Those two charts answer the first version of the question in one click. The rest of this guide goes a level deeper.
Step 2: settle the clock
MetaTrader 5 stamps every trade with the broker’s server clock, which is often two or three hours ahead of UTC and may change when daylight saving time starts or ends in the country your broker follows. Decide on one convention and keep it:
| Convention | Good for | Watch out for |
|---|---|---|
| Broker server time as shown | Matching the History tab and the calendar exactly. It is what the journal and the Excel report use | Sessions appear to move by an hour when the broker changes its clock |
| Convert to your own time | Thinking in your own day | You must convert every row the same way, and handle daylight saving yourself |
| Convert to UTC | Comparing with session open times worldwide | A bit more work. Subtract your broker’s offset |
The simplest and safest choice is to analyse in server time and translate the answer at the end: “my best hours are 10:00 to 12:00 broker time, which is early London for me.”
Step 3: bucket by hour
Add a helper column with the hour of the open time, =HOUR(F2) if the open time is in column F, or of the close time. Then count the trades and add up the results per hour. In a spreadsheet the formulas are:
| Per hour | Formula (hour in H1) |
|---|---|
| Number of trades | =COUNTIF(hourRange,H1) |
| Net result | =SUMIF(hourRange,H1,resultRange) |
| Win rate | =COUNTIFS(hourRange,H1,resultRange,">0")/COUNTIF(hourRange,H1) |
| Average result per trade | =AVERAGEIF(hourRange,H1,resultRange) |
A pivot table gives you the same in a few clicks: rows are the hour, values are the count and the sum of the result. Pick the open hour if you want to know when your entries work, and the close hour if you want to know when your results arrive. The two are not the same for trades that run for hours. The chart in the Excel report is based on the close hour, which is the hour the result was booked.
Step 4: respect the sample size
This is where most people go wrong. A bucket with five trades in it tells you nothing: one big loss or one big win decides the whole hour. Treat any bucket with fewer than a few dozen trades as a hint to collect more data, not as a result. If your history is short, widen the buckets, for example morning, midday and afternoon, or compare only two groups, such as “inside my planned session” and “outside it”.
What a result might look like (hypothetical)
| Window (broker time) | Trades | Net result | Average per trade |
|---|---|---|---|
| 07:00 to 09:00 | 42 | +$118 | +$2.81 |
| 09:00 to 12:00 | 96 | +$365 | +$3.80 |
| 12:00 to 15:00 | 58 | -$74 | -$1.28 |
| 15:00 to 18:00 | 71 | -$210 | -$2.96 |
| After 18:00 | 19 | -$41 | -$2.16 |
These numbers are invented. If real figures looked like this, the question would not be “should I stop trading after noon” but “why do I trade differently after noon?” Tiredness, a different market, a different strategy and a revenge trade after a morning loss are all possible. Open the trades from the weak window in the Journal page and read your notes before you decide.
Step 5: cross-check before you act
- By weekday. A weak hour may only be weak on Fridays or around news days.
- By setup. One losing setup concentrated in one hour looks like a bad hour.
- By symbol. Gold and a currency pair can behave differently in the same hour.
- By plan followed. If your plan-broken trades cluster in one window, the cure is a rule, not a schedule.
The tagging guide shows how to mark these cuts as you trade so that the comparison is one filter later.
Step 6: test the change forward
Suppose the evidence is clear enough to act. Do not rewrite your schedule on the strength of old data alone. Make one change, for example a smaller size or no new trades in the weak window, and keep journaling for a month or a fixed number of trades. If the weak window stays weak on new data, you have a result. If it does not, it was noise, which is also useful to know.
Honest limits
- Past hours say nothing certain about future ones. Markets change.
- The Excel report’s hour chart is built from the close hour in broker server time. Use the Trades sheet if you want the open hour.
- Small samples mislead. Pool more history, widen the buckets or wait.
- This page is general education, not trading advice, and no hour is guaranteed to be good.
For a routine that fits the hours you choose, see the forex trading daily routine, and for the weekly view of the same habit, the weekly review checklist. The Excel report guide lists every chart the report builds.
For a gold-specific version with session tags and an example table, see gold trading sessions in your journal.
To see when the sessions open where you live, use the forex session times converter, or read the pages for the UAE, Pakistan, India and South Africa. For gold, see gold trading hours.
Scheduled releases are part of 'when'. The Market Watch pages list central bank decisions and major US data each week, so you can mark those days when you compare your results by hour.
Frequently asked questions
What is the best time of day to trade forex?
How do I analyse my trades by hour?
Which time zone does MetaTrader 5 use?
How many trades do I need before an hour means anything?
Does AI Trading Journal show results by hour?
Related guides
- A local trading journal for MT5
- P&L calendar for MT5
- Trade notes, ratings and screenshots
- Trading progress and goals
- Back up your journal and move it to a new PC
- An offline trading journal for Windows
- How to set monthly trading goals
- Import your whole MT5 history
- How to tag trades
- Trade screenshots for your journal
- All trading journal comparisons
Get your hour and weekday charts automatically: free for 7 days
Free for 7 days, no card required. After that, a one-time $19.99 purchase. No subscription. Also on the Microsoft Store.
One-time $19.99, no monthly fee · your MT5 login never leaves your PC · trades go into your own journal on your PC, not through our servers.
Start free 7-day trial